If you have ever attempted to debug a performance problem on a Linux system, you know it can be overwhelming. CPU spikes, memory leaks, and random slowdowns can seem like invisible ghosts haunting your system.
This is where perf comes in — an advanced profiling tool that turns you from being merely a spectator into a detective of your Linux environment.
When I first learned about perf, it felt like it gave me a pair of X-ray glasses that let me see into the internal workings of my system. Magic, pure magic. In this blog, I will introduce you to perf, its most basic commands, and give you real-world examples of how it can put your troubleshooting on professional levels.
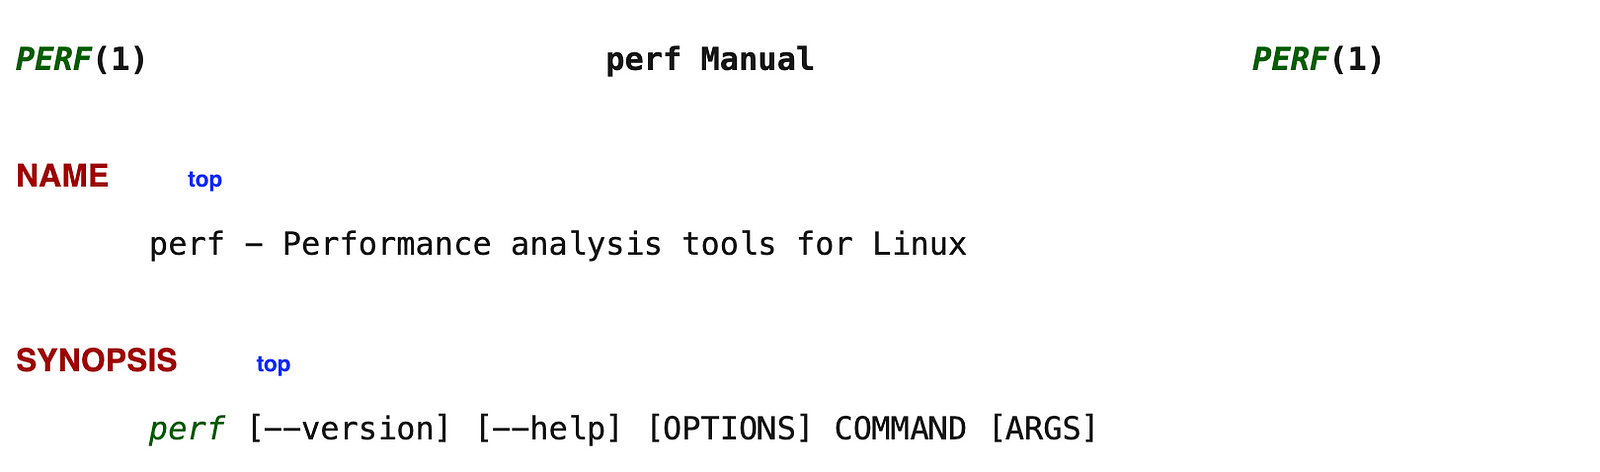
perf — What is it?
It is one of the most powerful performance analysis tools, integrated directly into the Linux kernel, which allows observation of system and application performance in real-time. It is a go-to tool for people trying to find bottlenecks, for sysadmins in need of diagnosis, and even for kernel developers trying to debug complex behaviours.
Why perf?
Suppose you are witnessing some random slowdown of a system or an application that uses more CPU than it is supposed to. With perf, you can witness, measure, and comprehend performance metrics at a granularity level: from CPU cycles to cache misses and branch mispredictions, all these metrics are at the tip of your fingers by using perf.
Real-Life Use Cases
Here is a quick look at how perf finds those hidden problems in your system:
- CPU Usage Profiling: Identify which process or function is taking the maximum time of the CPU.
- Memory Access Patterns: Identify memory bottlenecks that occur mainly because of cache misses.
- I/O Performance: Monitor disk I/O for any bottlenecks resulting in delays during data retrieval.
- Function-Level Profiling: This involves measuring performance even at the level of individual functions or code segments.
Each of these use cases would go a long way in bringing answers to many of those evasive performance problems. Let’s dive into perf commands that will help you tackle these scenarios.
Getting Started with perf
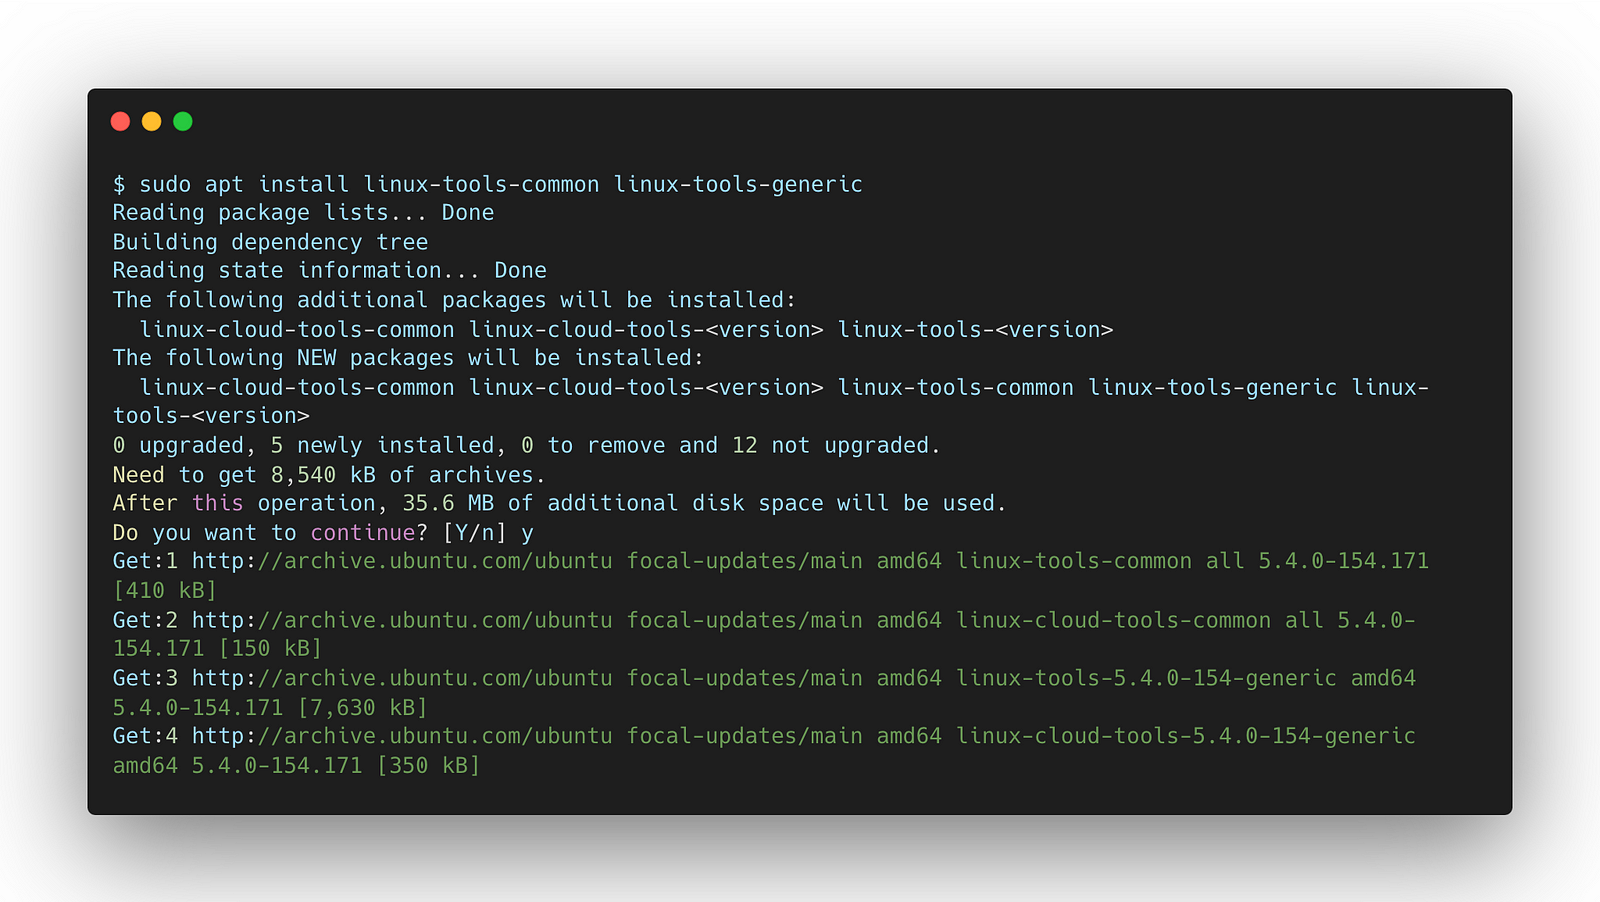
To get started with perf, first install it. This can usually be done on most Linux distributions by:
sudo apt install linux-tools-common linux-tools-generic
Once installed, here are the essential perf commands that will help you master Linux performance.
Note: This will work if you have Ubuntu. For other, you need to do bit of searching.
Quickly Diagnose CPU-Hungry Processes
perf stat: The Quick Health Check
- The
perf statcommand can be used as a quick health check for your system’s core functionality, a form of cursory performance overview that allows you to immediately identify CPU-hungry applications.
perf stat -p <pid>
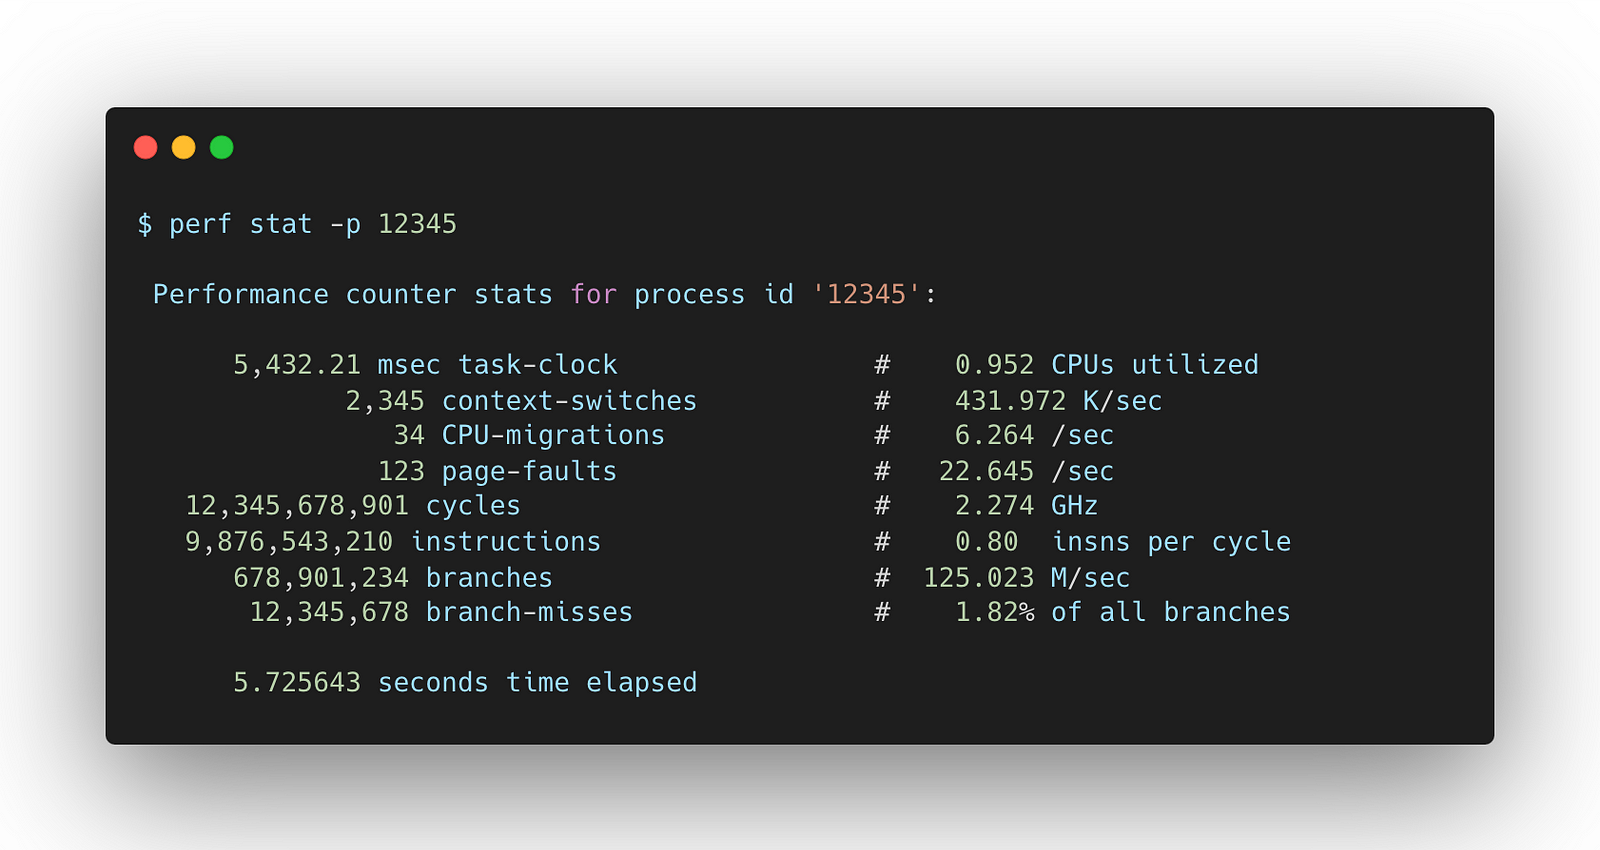
- Replace
<pid>with the process ID you want to monitor. The previous command provides metrics like CPU cycles, instructions per cycle, and cache references for that process. - Real-World Application: I use perf stat all the time when I think some application uses too much CPU. If I run it on the process in question, I will know right away if it is a CPU-bound issue, and then I can change the settings or appropriately optimize the code.
Your X-Ray Vision
perf record + perf report: Capturing In-Depth Insights
- Imagine you can set up a camera on your system to record its every move.
perf recorddoes just that, recording all of the performance data, whileperf reportlets you replay it and analyze the capture.
perf record -p <pid> -g -- sleep 5 perf report
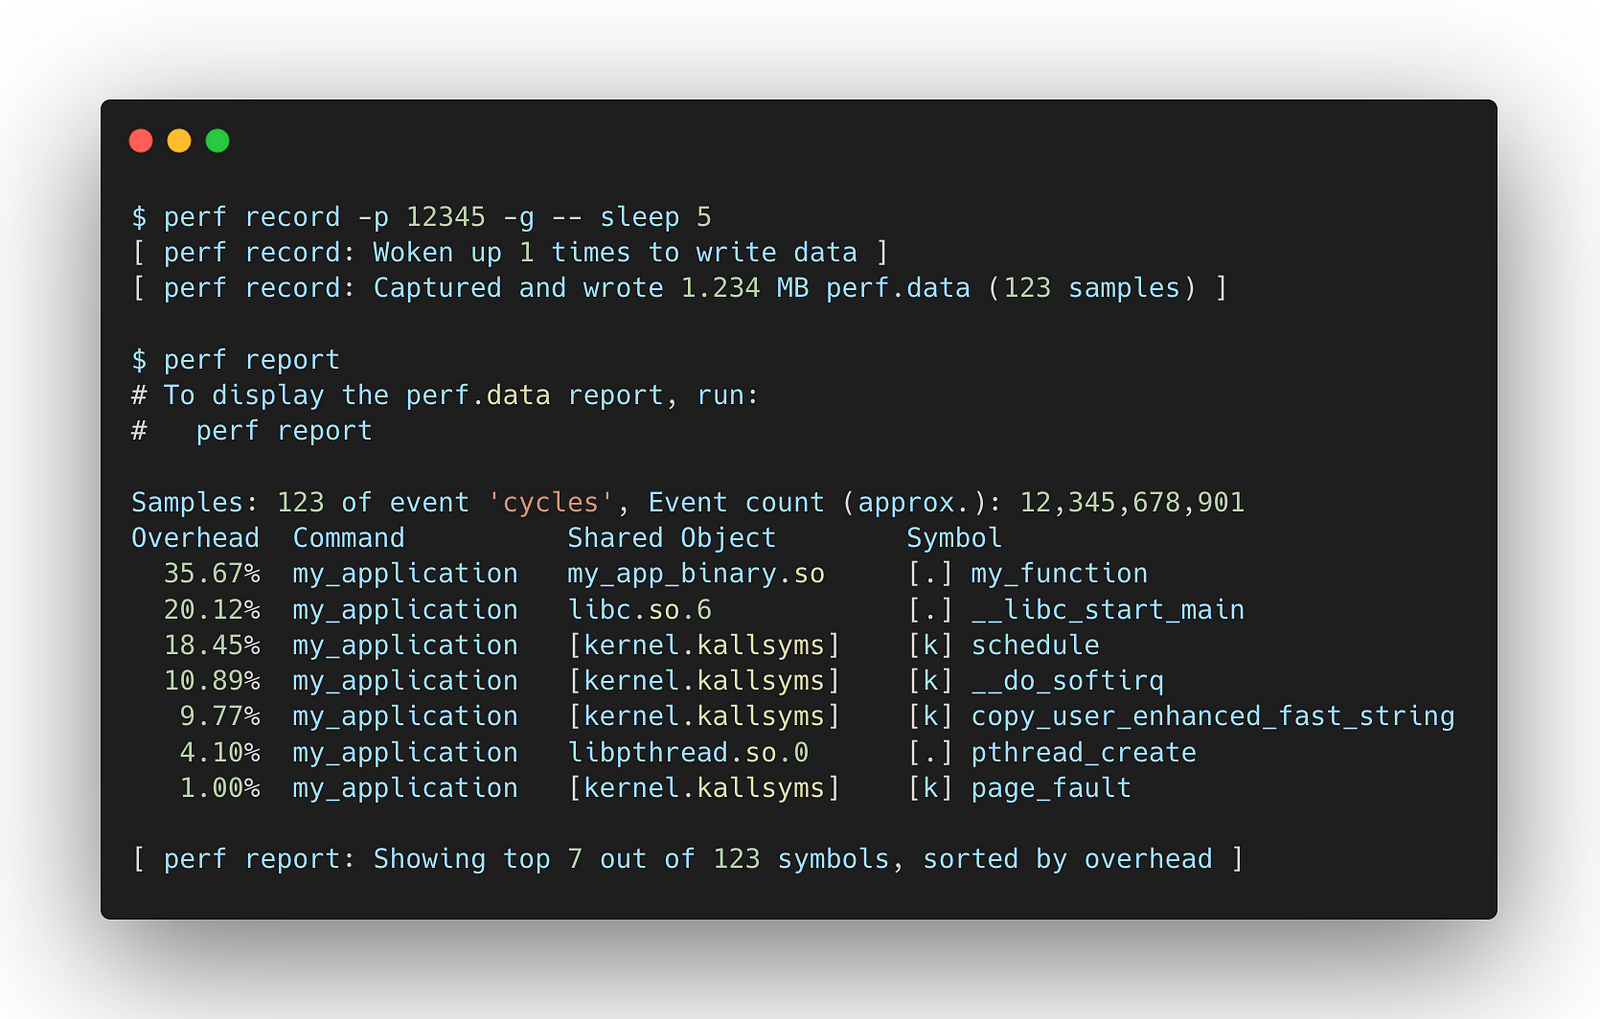
- This captures performance data for 5 seconds for the specified process; the
-gflag enables a call graph to capture function calls. - Real-World Scenario I once used this combination to diagnose a slow Python application. perf report showed that a single function was spending 40% CPU time on an extremely inefficient loop. Optimizing that loop chopped execution time in half!
Top on Steroids: Real-Time Function Profiling
perf top: Real-Time Performance Observation
perf top: This is like top on steroids, showing real-time performance down to the level of functions. It can be very useful for live monitoring, especially during load testing.
perf top
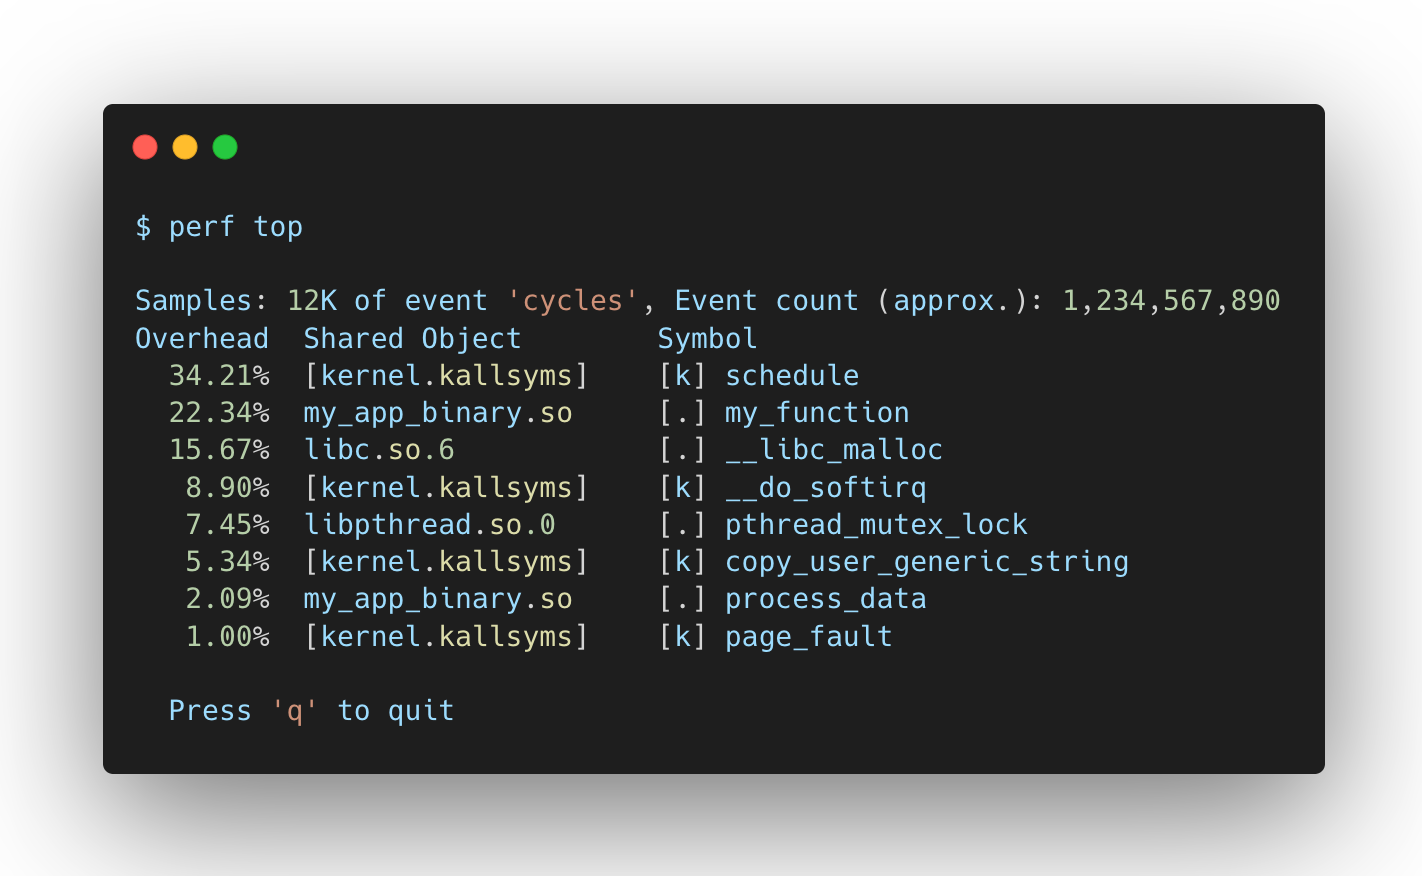
Real-World Example: During a load test, I was able to use perf top to identify functions causing unexpected spikes in CPU. Identifying these functions allows me to take immediate action to fine-tune the application for peak efficiency.
Dissect Your Code’s Performance
perf annotate: Analyze Code-Level Performance
perf annotateis a game-changer for any developer. It provides the power to show you which lines of a function take up the most resources, thus acting as a magnifying glass to your code’s performance.
perf annotate -p <pid>
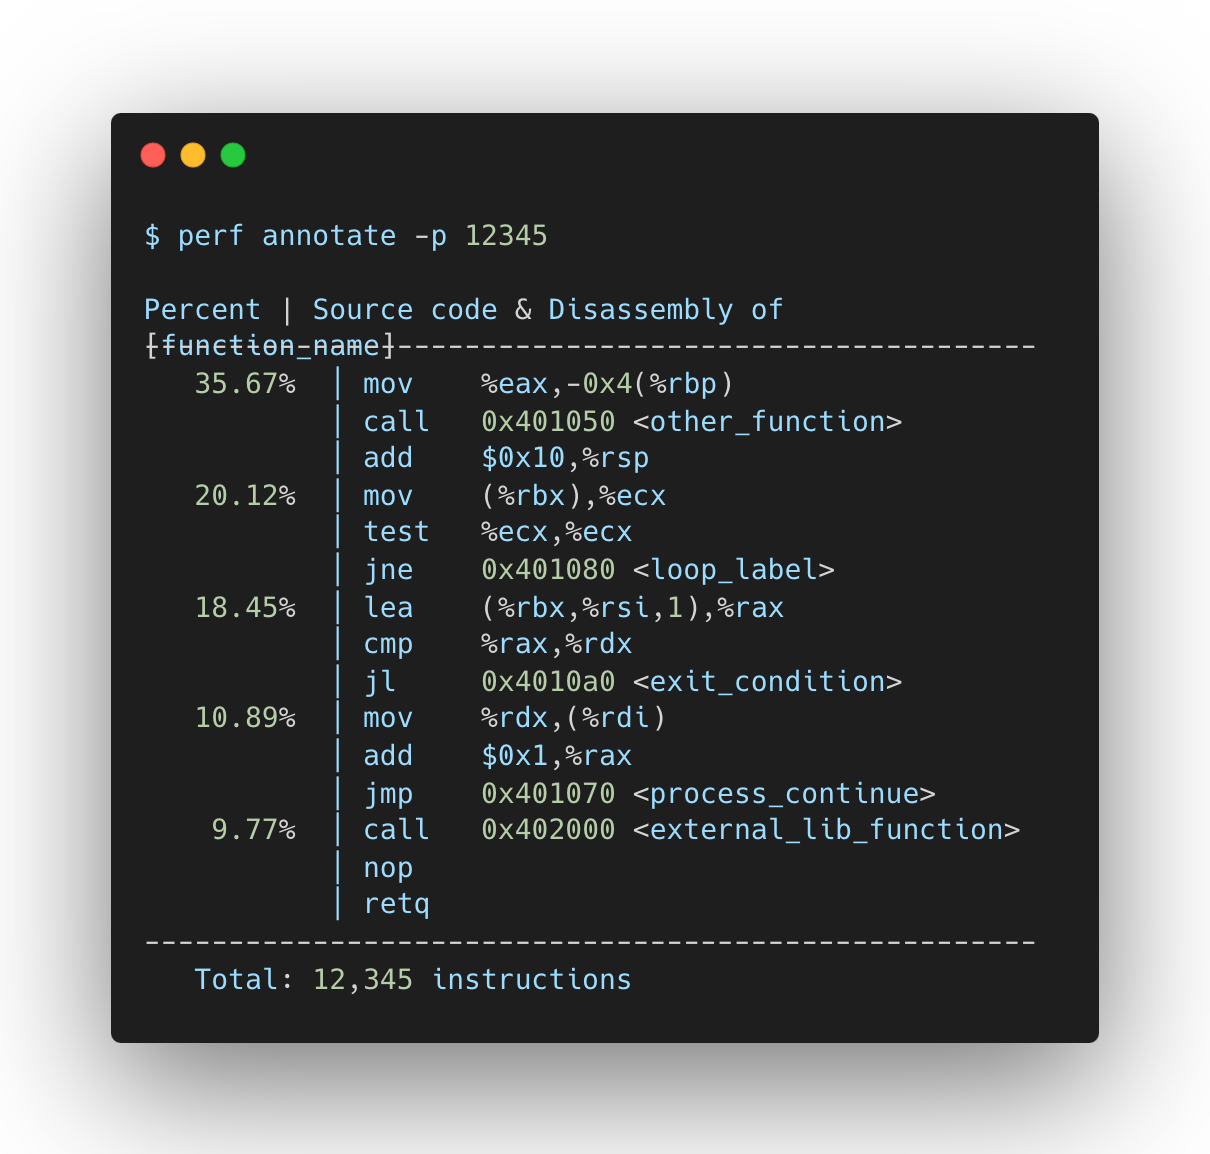
- This allows you to view annotated code, where hotspots — lines with high CPU usage — are highlighted so you can zero in on lines needing optimization.
- Real-World Application I used perf annotate on a C++ application that had a very slow-running function. The output showed clearly that a regex operation was a bottleneck. Replacing it with a more efficient approach dramatically improved performance.
Bonus Tip: Custom Event Monitoring with perf
Sometimes, the default metrics don’t include what you need. perf supports custom events, allowing the monitoring of metrics such as branch mispredictions or memory stalls.
perf stat -e branches,branch-misses -p <pid>
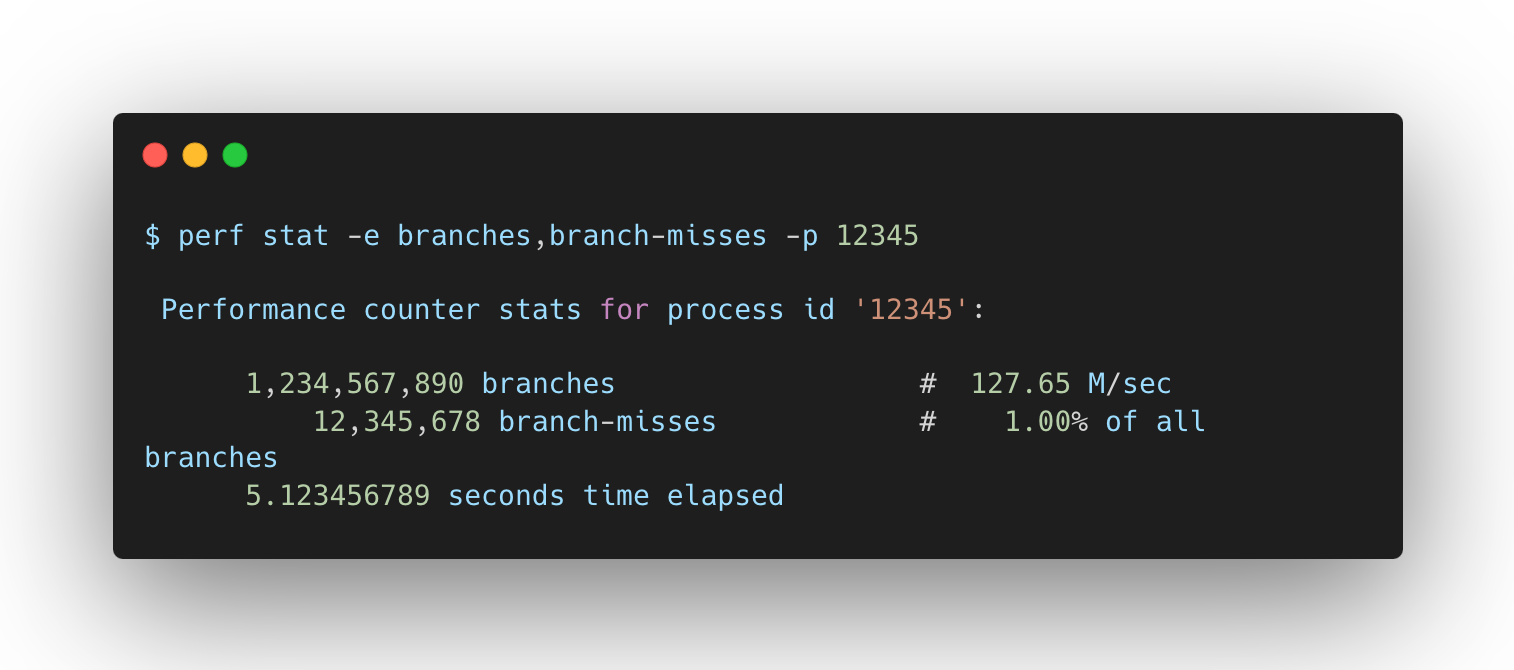
Real-world application Branch mispredictions were a mystery to me before, but this metric brought clarity, and with it, I optimised conditional statements in a high-performance application, decreasing branch misses and boosting efficiency.
Wrapping Up: My Journey with perf
Mastering perf has been transformative for my approach to Linux performance. Initially, it wasn’t very safe, but as I grew more comfortable, it saved me countless hours of debugging. Here’s what I learned:
- Take quick performance snapshots with perf stat.
- Use perf record with perf report to get deep insight.
- Run perf top for real-time monitoring.
- Use perf annotate to analyze code-level hotspots.
- Observe custom events for deeper insight into specific aspects of performance.
Each time I use perf, I learn more about my system’s inner workings. The next time you encounter a performance issue, give perf a try — you might be surprised.
Final Thoughts
perf is not just a tool; it’s a mirror into the deepest workings of your system. With each experiment, you prepare yourself to tackle tomorrow’s challenges more effectively. Dive in and see what perf reveals, as every discovery brings you closer to Linux performance mastery.
Make sure to subscribe for more insights into cloud blogs and web solutions.